Why Metrics Are Essential for DM Automation
A comment-to-DM flow that triggers 100 conversations per week and converts 2% is generating 2 sales. The same flow with a 10% conversion rate is generating 10 sales — with zero additional content output. Optimising conversion through metrics is the highest-leverage activity in any DM automation setup, yet most operators set up their flows and never look at the numbers again.
These are the metrics that matter, what good performance looks like, and how to diagnose and fix underperformance at each stage.
Metric 1: Keyword Comment Rate
What it is: The percentage of post views (or reach) that result in a keyword comment.
Benchmark: 0.5–3% is typical for reels with a comment CTA. Above 3% indicates exceptional content-offer alignment.
How to improve: Test different keywords in your caption CTA. Test different resource offers paired with different content topics. The most common mistake is offering a generic resource after topic-specific content — the resource should be a natural deep-dive from exactly what the reel taught.
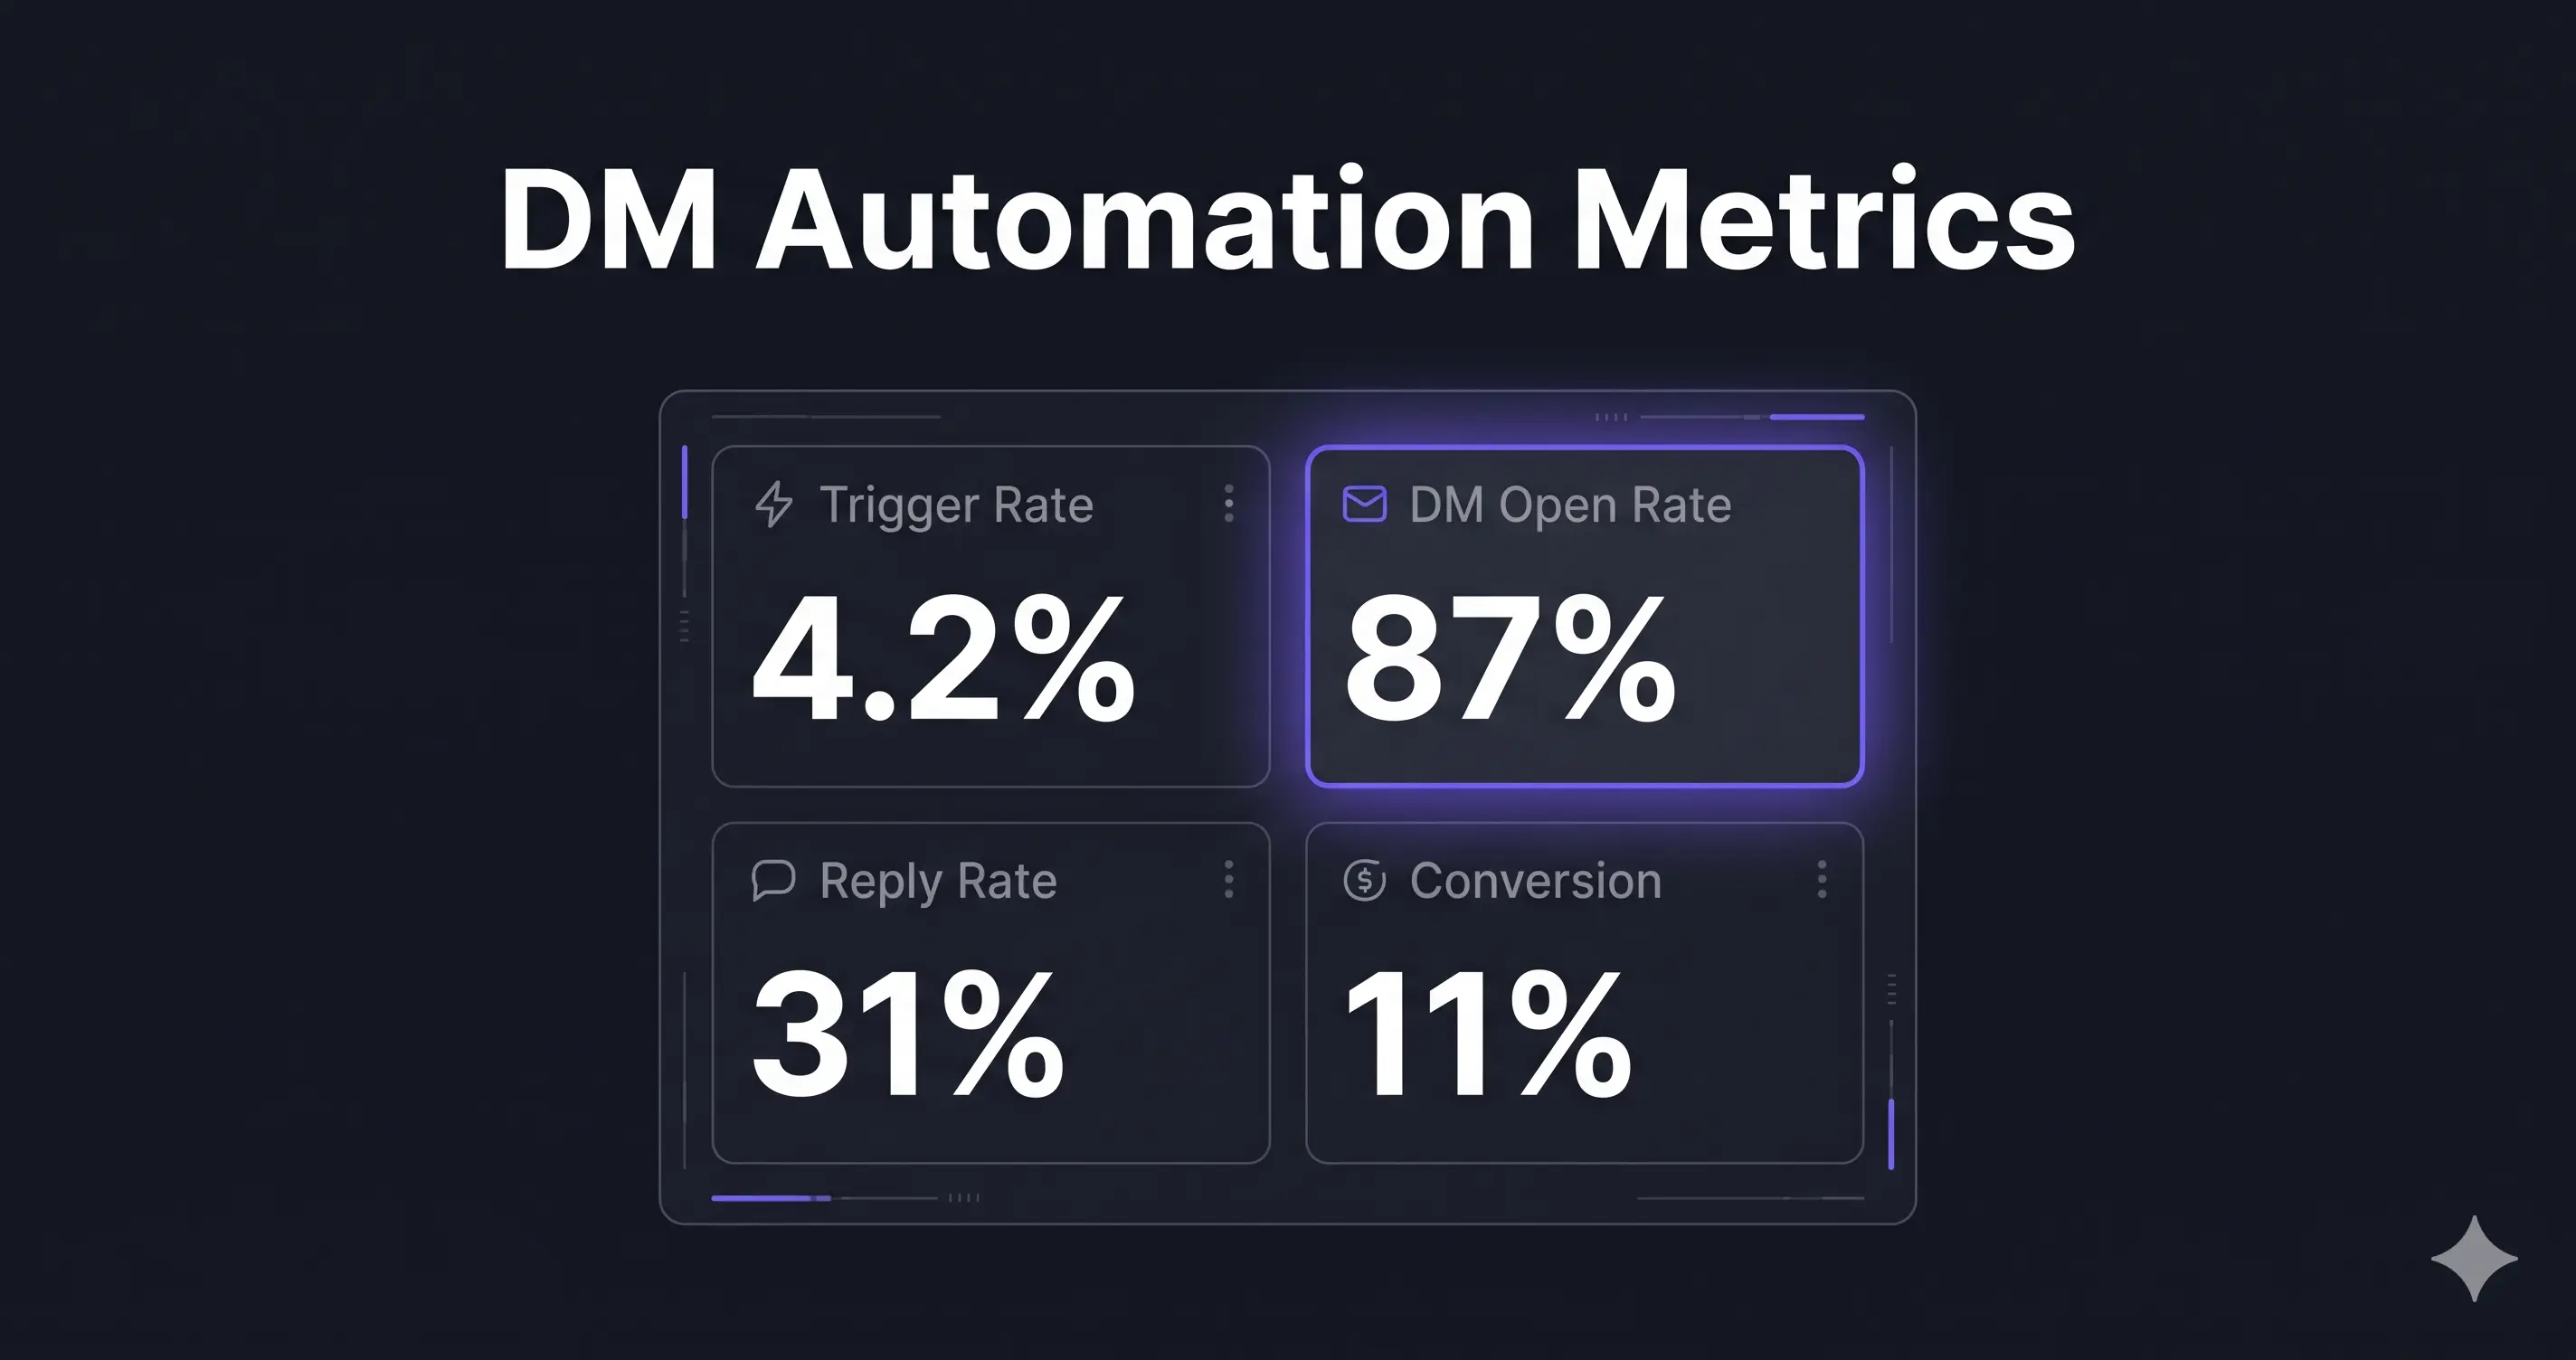
Metric 2: DM Open Rate
What it is: The percentage of triggered DMs that are opened by the recipient.
Benchmark: 70–90%. Instagram DMs have much higher open rates than email because they arrive as push notifications and live in the same inbox as personal messages.
How to improve: The first line of the DM is the notification preview text. Make it immediately relevant and specific to what the commenter just did: "Hey [Name], here's your [specific resource] — just like you asked for!" Generic openers like "Thanks for commenting!" have lower open rates because they don't surface the value immediately.
Metric 3: Reply Rate (Sequence Engagement)
What it is: The percentage of DM recipients who reply to at least one message in the sequence.
Benchmark: 15–35%. Higher reply rates indicate stronger audience-content alignment and more conversational DM copy.
How to improve: End every DM message with a direct, easy-to-answer question. Not an open-ended prompt, but a specific question with a low-friction answer: "Was this your first time trying [topic], or have you been working on it for a while?" Two-option questions consistently generate higher reply rates than open-ended questions.
Metric 4: Sequence Completion Rate
What it is: The percentage of leads who receive all messages in the sequence (vs. dropping off by unsubscribing or not opening later messages).
Benchmark: 40–70%. A sequence with a 40% completion rate at 7 messages is performing well. Below 30% indicates messages are losing relevance or the sequence is too long.
How to improve: Analyse which message in the sequence has the biggest open-rate drop. That message or the one before it is where you're losing people. Rewrite the preceding message to create more urgency or relevance for the next step.
Metric 5: Offer Conversion Rate
What it is: The percentage of leads who receive the offer message and then purchase (or book a call).
Benchmark: 5–15% for digital products under $200. 2–8% for coaching programs $500+. 15–30% for booked call rates from qualified DM sequences.
How to improve: Test the offer framing (outcome-first vs. feature-first). Test the timing (day 5 vs. day 3). Test the offer price point or entry-level product. Offer conversion is the most important metric to optimise because a 2% improvement compounds across every lead your flow touches.
Frequently Asked Questions
How do I access DM automation analytics in Flonix?
Flonix's analytics dashboard shows trigger volume, DM delivery rate, open rate, and reply rate per flow. Offer conversion tracking requires connecting your payment platform or tracking UTM links in offer messages to determine downstream purchase attribution.
How often should I review these metrics?
Weekly for active flows during launch periods. Monthly for evergreen flows. Any flow generating fewer than 50 triggers per month doesn't have enough data for statistically meaningful optimisation — focus on improving content reach first before optimising sequence copy.